# Set optionsoptions(scipen =999) # No scientific notationset.seed(5080) # Reproducibility# Packageslibrary(tidyverse) # Data manipulationlibrary(sf) # Spatial operationslibrary(here) # Relative file pathslibrary(viridis) # Color scaleslibrary(terra) # Raster operations (replaces 'raster')library(spdep) # Spatial dependencelibrary(FNN) # Fast nearest neighborslibrary(MASS) # Negative binomial regressionlibrary(patchwork) # Plot composition (replaces grid/gridExtra)library(knitr) # Tableslibrary(kableExtra) # Table formattinglibrary(classInt) # Classification intervals# Spatstat split into sub-packageslibrary(spatstat.geom) # Spatial geometrieslibrary(spatstat.explore) # Spatial exploration/KDE# Set optionsoptions(scipen =999) # No scientific notationset.seed(5080) # Reproducibility# Create consistent theme for visualizationstheme_crime <-function(base_size =11) {theme_minimal(base_size = base_size) +theme(plot.title =element_text(face ="bold", size = base_size +1),plot.subtitle =element_text(color ="gray30", size = base_size -1),legend.position ="right",panel.grid.minor =element_blank(),axis.text =element_blank(),axis.title =element_blank() )}# Set as defaulttheme_set(theme_crime())
Data Loading & Exploration
First, some contextual boundaries are being loaded. We have Chicago Police District boundaries, Police Beats (smaller than districts), and the City boundary itself.
We’re using ESRI:102271 (Illinois State Plane East, NAD83, US Feet). This is appropriate for Chicago because:
It minimizes distortion in this region
Uses feet (common in US planning)
Allows accurate distance calculations
Eventually, we will create predictive models for burglaries. Here, we load Chicago Burglary data.
Code
# Load from provided data file (downloaded from Chicago open data portal)burglaries <-st_read("./data/burglaries.shp", quiet =TRUE) %>%st_transform('ESRI:102271', quiet =TRUE)cat(glue::glue("### Burglary Data Check**✓ Loaded burglary data**- **Number of burglaries:** {nrow(burglaries)}- **CRS:** {st_crs(burglaries)$input}- **Date range:** {min(burglaries$date, na.rm = TRUE)} to {max(burglaries$date, na.rm = TRUE)}"))
### Burglary Data Check

**✓ Loaded burglary data**

- **Number of burglaries:** 7482
- **CRS:** ESRI:102271
- **Date range:** Inf to -Inf
One predictor that will be explored is 311 Data focused on street light outages. Specifically, this data contains points where single street light outages were reported. I chose this feature mostly out of curiosity. Vacant buildings, abandoned cars, etc are examples of physcial properties that can be connected to crimes, but street light outages on a surface level seem less connected.
Visualizing Single Street Light Outages from 311 Data
Simple Choropleth Map
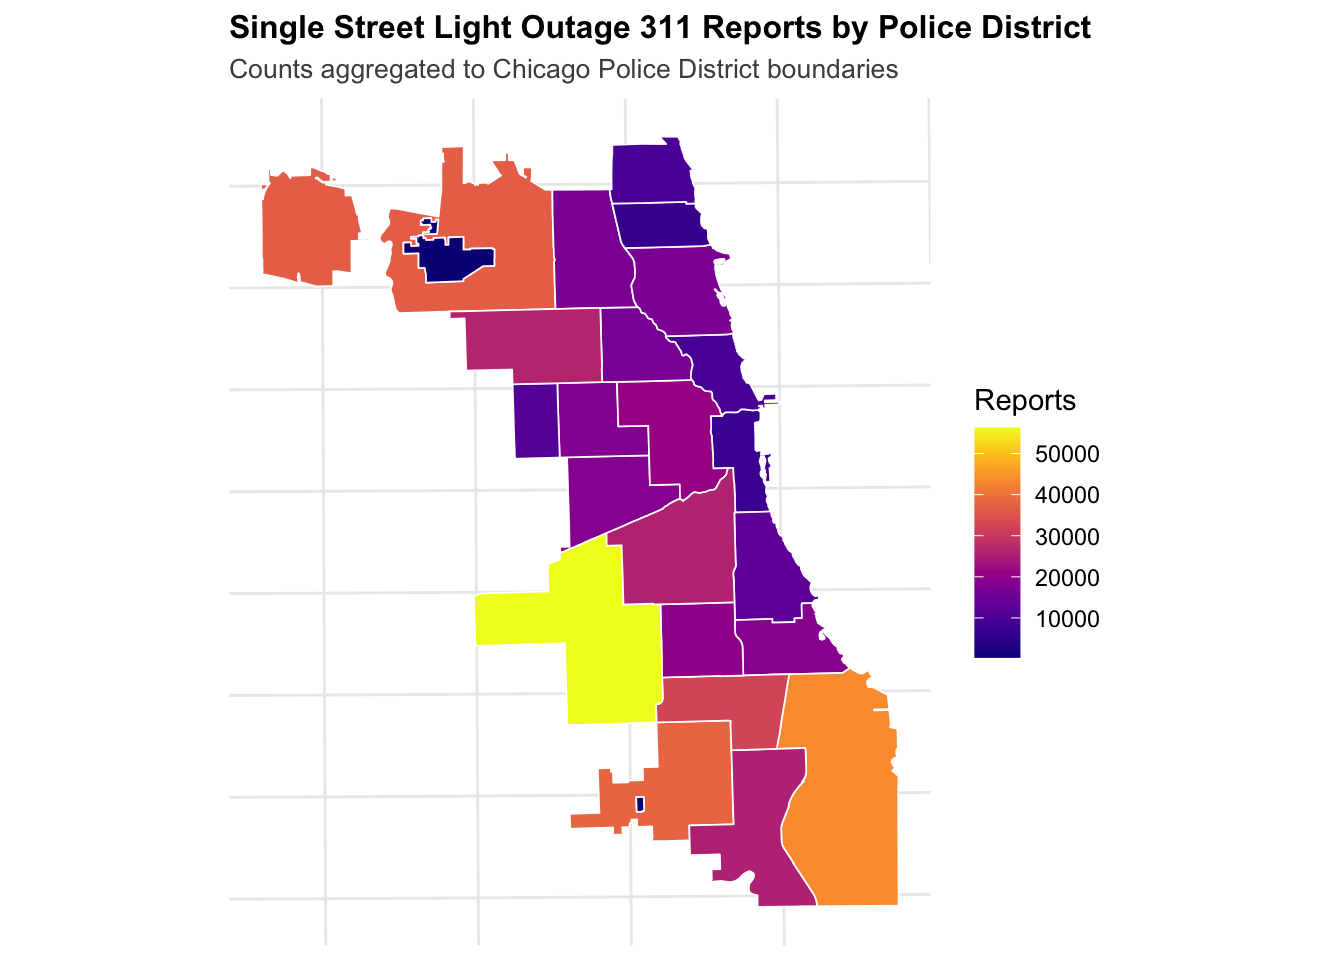
First, I want to visualize the single lights outage data with a choropleth map using Chicago PD boundaries. This will not be the most insightful visualization, but I want to get an idea of the data before proceeding with other methods.
Code
# Aggregate street lights out by police districtlights_by_district <- policeDistricts %>%st_join(street_lights) %>%count(District, name ="lights_out")# Choropleth mapggplot() +geom_sf(data = lights_by_district, aes(fill = lights_out), color ="white", size =0.3) +scale_fill_viridis(option ="plasma", direction =1) +labs(title ="Single Street Light Outage 311 Reports by Police District",subtitle ="Counts aggregated to Chicago Police District boundaries",fill ="Reports" ) +theme_crime()
Here, we see the greatest number of reports in southern, south-western, and north-western Police Districts, and lower numbers in central and northern ones.
Fishnet Grid and Visualization
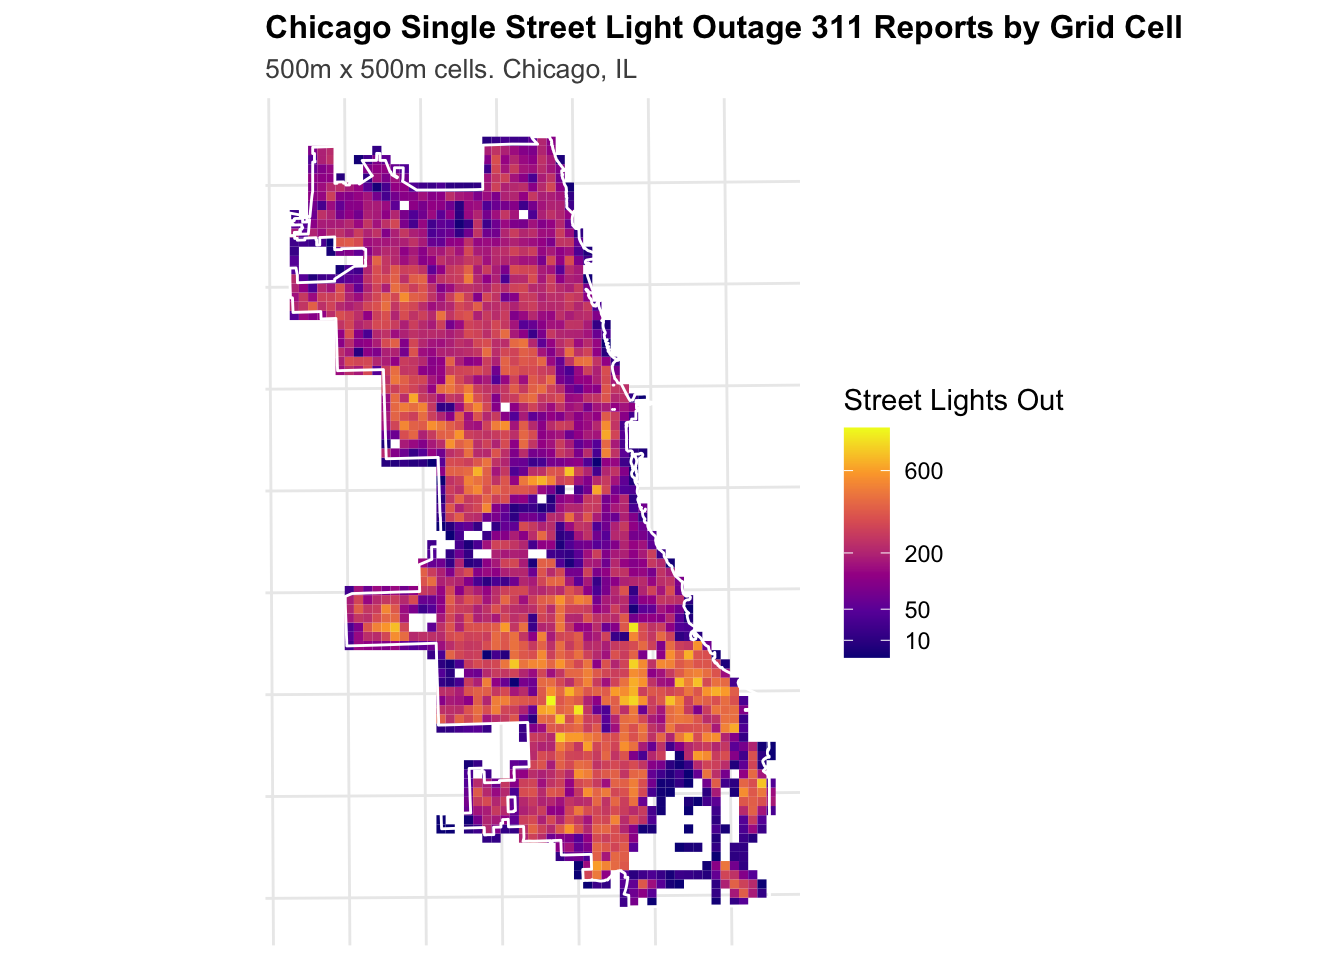
As stated previously, arbitrary boundaries like police districts make analysis more complicated and less reliable for real-world conditions. Here, we use a 500m x 500m “fishnet” over the City of Chicago, where each grid cell has aggregated counts for 311 Single Light Outage complaints.
Code
# Create a 500mx500m fishnetfishnet_lights <-st_make_grid( chicagoBoundary,cellsize =500,square =TRUE) %>%st_sf() %>%mutate(uniqueID =row_number())# Aggregate burglaries to the same fishnet gridburglaries_fishnet <-st_join(burglaries, fishnet_lights, join = st_within) %>%st_drop_geometry() %>%group_by(uniqueID) %>%summarize(countBurglaries =n())# Join burglary counts to fishnetfishnet_lights <- fishnet_lights %>%left_join(burglaries_fishnet, by ="uniqueID") %>%mutate(countBurglaries =replace_na(countBurglaries, 0))# Spatial join: assign each street light to a grid celllights_fishnet <-st_join(street_lights, fishnet_lights, join = st_within) %>%st_drop_geometry() %>%group_by(uniqueID) %>%summarize(countLights =n())# Join back to fishnet (cells with zero lights will be NA → convert to 0)fishnet_lights <- fishnet_lights %>%left_join(lights_fishnet, by ="uniqueID") %>%mutate(countLights =replace_na(countLights, 0))# Finally, I want to filter out cells with zero counts, as that will mess wth future analysisfishnet_lights <- fishnet_lights %>%filter(countLights >0)
Code
ggplot() +geom_sf(data = fishnet_lights, aes(fill = countLights), color =NA) +geom_sf(data = chicagoBoundary, fill =NA, color ="white", linewidth =0.5) +scale_fill_viridis_c(name ="Street Lights Out",option ="plasma",trans ="sqrt",breaks =c(0, 10, 50, 200, 600) ) +labs(title ="Chicago Single Street Light Outage 311 Reports by Grid Cell",subtitle ="500m x 500m cells. Chicago, IL" ) +theme_crime()
Here, the fishnet grid provides a more granular view of street light outages across the city. In the southernmost police district—which the choropleth map previously suggested had the highest number of 311 complaints—we now see substantial variation: much of the district has relatively few complaints, while hotspots appear in the northern portions. Similarly, northern and western Chicago contains concentrated pockets of higher complaint activity that are obscured when aggregated at the district level.
We can explore this spatial variation in the following section.
   Min. 1st Qu.  Median    Mean 3rd Qu.    Max.
   1.89   29.32   45.95   66.50   75.31  625.47
Code
# Function to calculate Local Moran's Icalculate_local_morans <-function(data, variable, k =3) {# Create spatial weights coords <-st_coordinates(st_centroid(data)) neighbors <-knn2nb(knearneigh(coords, k = k)) weights <-nb2listw(neighbors, style ="W", zero.policy =TRUE)# Calculate Local Moran's I local_moran <-localmoran(data[[variable]], weights)# Classify clusters mean_val <-mean(data[[variable]], na.rm =TRUE) data %>%mutate(local_i = local_moran[, 1],p_value = local_moran[, 5],is_significant = p_value <0.05,moran_class =case_when(!is_significant ~"Not Significant", local_i >0& .data[[variable]] > mean_val ~"High-High", local_i >0& .data[[variable]] <= mean_val ~"Low-Low", local_i <0& .data[[variable]] > mean_val ~"High-Low", local_i <0& .data[[variable]] <= mean_val ~"Low-High",TRUE~"Not Significant" ) )}fishnet_lights_morans <-calculate_local_morans(fishnet_lights, "countLights", k =5)# Visualize clustersggplot() +geom_sf(data = fishnet_lights_morans, aes(fill = moran_class), color =NA) +geom_sf(data = chicagoBoundary, fill =NA, color ="black", linewidth =0.4) +scale_fill_manual(values =c("High-High"="#d7191c","High-Low"="#fdae61","Low-High"="#abd9e9","Low-Low"="#2c7bb6","Not Significant"="gray90" ),name ="Cluster Type" ) +labs(title ="Local Moran's I: Street Light Outage Clusters",subtitle ="High-High = Hot spots of outages; k=3 neighbors" ) +theme_crime()
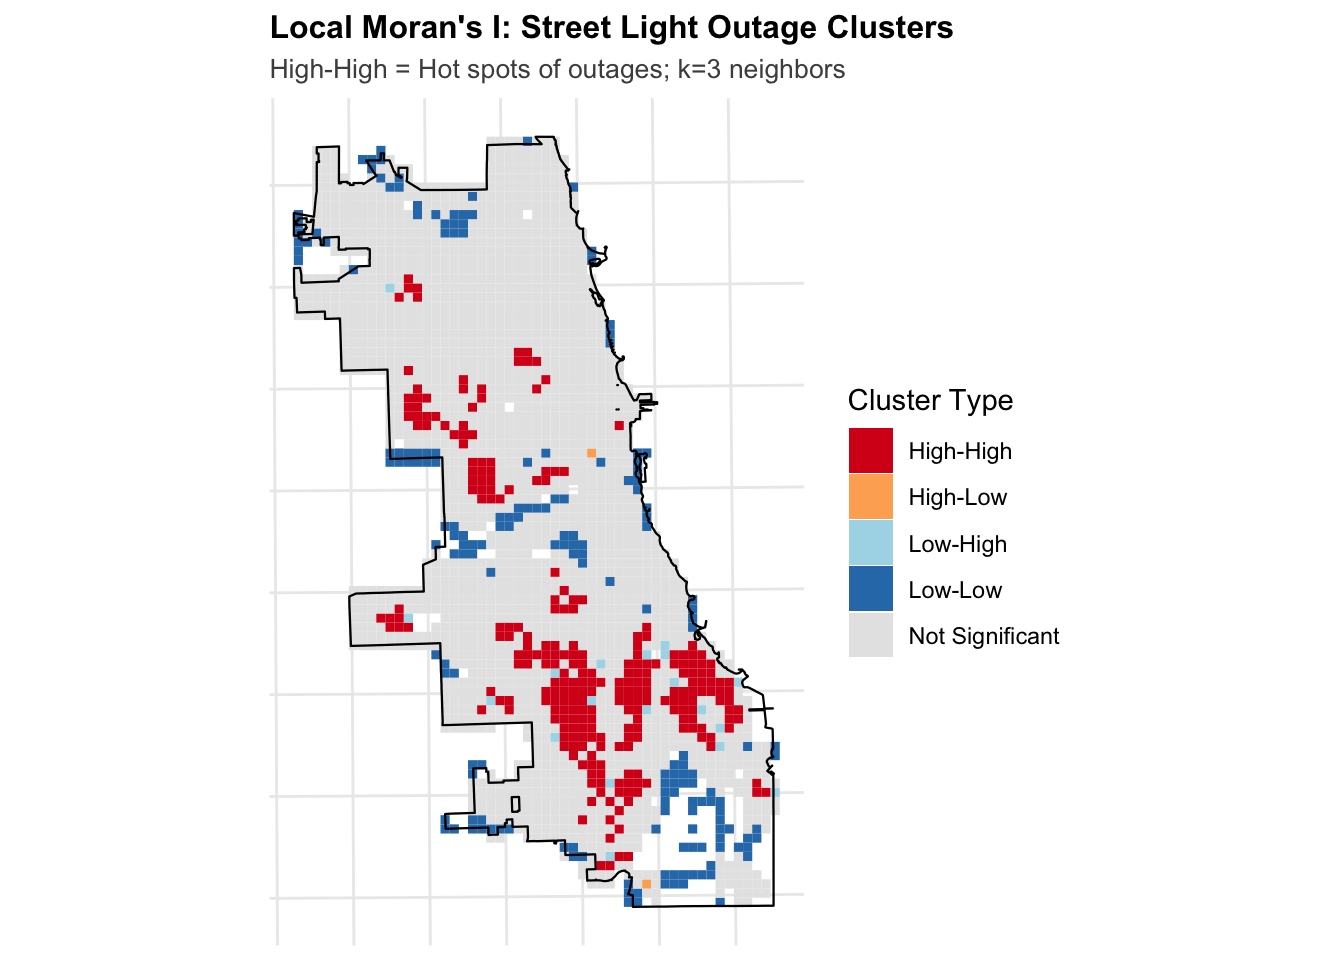
The calculate_local_morans function was provided in class. The function wraps R’s localmoran() to automate spatial weight creation and classify cells into interpretable cluster types (High-High, Low-Low, etc.), which localmoran() doesn’t provide—it only returns raw statistics.
The Local Moran’s I results confirm clustering visible in the fishnet map, with High-High clusters concentrated in South Chicago where high outage counts are surrounded by other high-count cells. Areas of High-High and Low-Low cells can be considered as hotspots and coldspots respectively. This can be a useful parameter for the remainder of this report, so it is calculated below. In addition, we can calculate distances between every cell and the nearest hot and cold spots.
Code
# Get centroids of "High-High" cells (hot spots)hotspots <- fishnet_lights_morans %>%filter(moran_class =="High-High") %>%st_centroid()# Calculate distance from each cell to nearest hot spotif (nrow(hotspots) >0) { fishnet_lights_morans <- fishnet_lights_morans %>%mutate(dist_to_hotspot =as.numeric(st_distance(st_centroid(fishnet_lights_morans), hotspots %>%st_union()) ) )cat("✓ Calculated distance to single light outage hot spots\n")cat(" - Number of hot spot cells:", nrow(hotspots), "\n")} else { fishnet_lights_morans <- fishnet_lights_morans %>%mutate(dist_to_hotspot =0)cat("⚠ No significant hot spots found\n")}
✓ Calculated distance to single light outage hot spots
  - Number of hot spot cells: 260
Code
# Get centroids of "Low-Low" cells (cold spots)coldspots <- fishnet_lights_morans %>%filter(moran_class =="Low-Low") %>%st_centroid()# Calculate distance from each cell to nearest cold spotif (nrow(coldspots) >0) { fishnet_lights_morans <- fishnet_lights_morans %>%mutate(dist_to_coldspot =as.numeric(st_distance(st_centroid(fishnet_lights_morans), coldspots %>%st_union()) ) )cat("✓ Calculated distance to single light outage cold spots\n")cat(" - Number of cold spot cells:", nrow(coldspots), "\n")} else { fishnet_lights_morans <- fishnet_lights_morans %>%mutate(dist_to_coldspot =0)cat("⚠ No significant cold spots found\n")}
✓ Calculated distance to single light outage cold spots
  - Number of cold spot cells: 180
Code
# Summary statistics for distance featurestibble(Metric =c("Min", "Q1", "Median", "Mean", "Q3", "Max"),`Distance to Hot Spots`=summary(fishnet_lights_morans$dist_to_hotspot),`Distance to Cold Spots`=summary(fishnet_lights_morans$dist_to_coldspot)) %>%kable(caption ="Summary Statistics: Distance to Hot Spots and Cold Spots (feet)",digits =0,format.args =list(big.mark =",") ) %>%kable_styling(bootstrap_options =c("striped", "hover", "condensed"))
Summary Statistics: Distance to Hot Spots and Cold Spots (feet)
Metric
Distance to Hot Spots
Distance to Cold Spots
Min
0.0
0
Q1
707.1
1,000
Median
1,581.1
1,803
Mean
2,200.3
2,116
Q3
3,041.4
3,041
Max
10,965.9
6,265
Count Regression Models
Poisson Regression
Since light outages are simple counts, we can first try to create a Poisson Regression Model.
Code
# Join district information to fishnetfishnet_lights_morans <-st_join( fishnet_lights_morans, policeDistricts,join = st_within,left =TRUE)# Filter using base R subsettingfishnet_lights_morans <- fishnet_lights_morans[!is.na(fishnet_lights_morans$District), ]cat("✓ Joined police districts\n")
The Poisson regression shows that all four street light features are statistically significant predictors of burglary counts. Areas with more light outages tend to have more burglaries, and being closer to outage hotspots is associated with higher counts of burglaries as well. However, the high residual deviance confirms overdispersion, which is why we can try the Negative Binomial model instead.
Negative Binomial
Code
# Fit Negative Binomial model predicting BURGLARIESmodel_nb_burglary <-glm.nb( countBurglaries ~ countLights + lights_out_nn + dist_to_hotspot + dist_to_coldspot,data = fishnet_lights_morans)# Summarysummary(model_nb_burglary)
Call:
glm.nb(formula = countBurglaries ~ countLights + lights_out_nn +
    dist_to_hotspot + dist_to_coldspot, data = fishnet_lights_morans,
    init.theta = 2.007649347, link = log)

Coefficients:
                    Estimate  Std. Error z value             Pr(>|z|)
(Intercept)       0.91119504  0.09865200   9.236 < 0.0000000000000002 ***
countLights       0.00197739  0.00019753  10.011 < 0.0000000000000002 ***
lights_out_nn    -0.00797075  0.00077198 -10.325 < 0.0000000000000002 ***
dist_to_hotspot  -0.00004062  0.00001388  -2.925              0.00344 **
dist_to_coldspot  0.00012039  0.00001698   7.092     0.00000000000132 ***
---
Signif. codes:  0 '***' 0.001 '**' 0.01 '*' 0.05 '.' 0.1 ' ' 1

(Dispersion parameter for Negative Binomial(2.0076) family taken to be 1)

    Null deviance: 2445.8  on 1610  degrees of freedom
Residual deviance: 1779.9  on 1606  degrees of freedom
AIC: 7295.1

Number of Fisher Scoring iterations: 1

              Theta:  2.008
          Std. Err.:  0.121

 2 x log-likelihood:  -7283.051
Code
# Compare modelscat("\n### Model Comparison (AIC - lower is better):\n")
The Negative Binomial model shows all predictors remain significant, with the same relationships: more light outages and closer proximity to hotspots are associated with higher burglary counts. The much lower AIC (7,295 vs 8,477.6) confirms this model performs better than Poisson.
Spatial Cross Validation
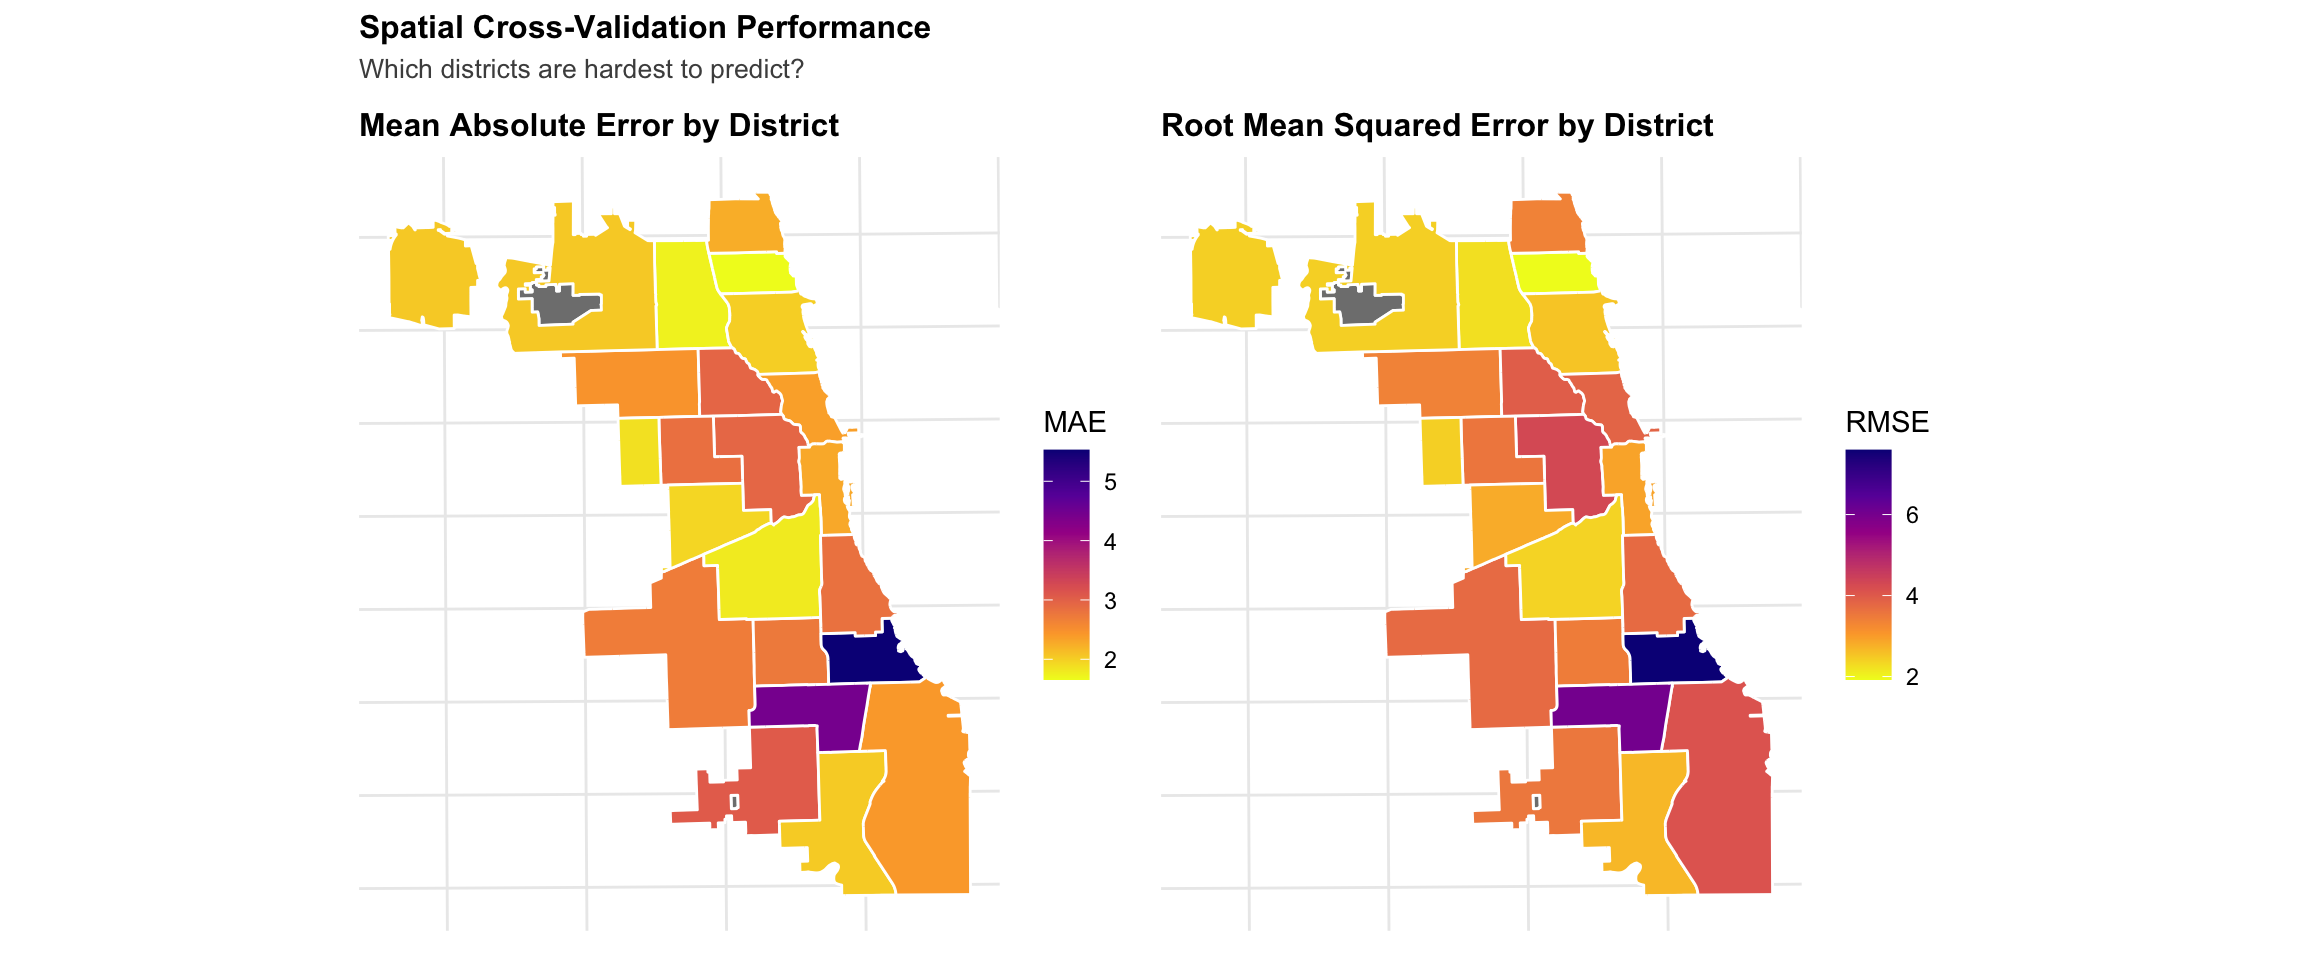
Standard cross-validation randomly splits data, but with spatial data this means training on cells directly adjacent to test cells (spatial information leakage). Leave-One-Group-Out (LOGO) Cross-Validation addresses this by training on all police districts except one, then testing on the held-out district.
# Join CV results to police districts for mappingdistricts_cv <- policeDistricts %>%left_join(cv_results, by =c("District"="test_district"))# Map MAE by districtp1 <-ggplot() +geom_sf(data = districts_cv, aes(fill = mae), color ="white", linewidth =0.5) +scale_fill_viridis_c(name ="MAE",option ="plasma",direction =-1 ) +labs(title ="Mean Absolute Error by District" ) +theme_crime()# Map RMSE by districtp2 <-ggplot() +geom_sf(data = districts_cv, aes(fill = rmse), color ="white", linewidth =0.5) +scale_fill_viridis_c(name ="RMSE",option ="plasma",direction =-1 ) +labs(title ="Root Mean Squared Error by District" ) +theme_crime()p1 + p2 +plot_annotation(title ="Spatial Cross-Validation Performance",subtitle ="Which districts are hardest to predict?" )
Model Evaluation
Generate Final Predictions
Code
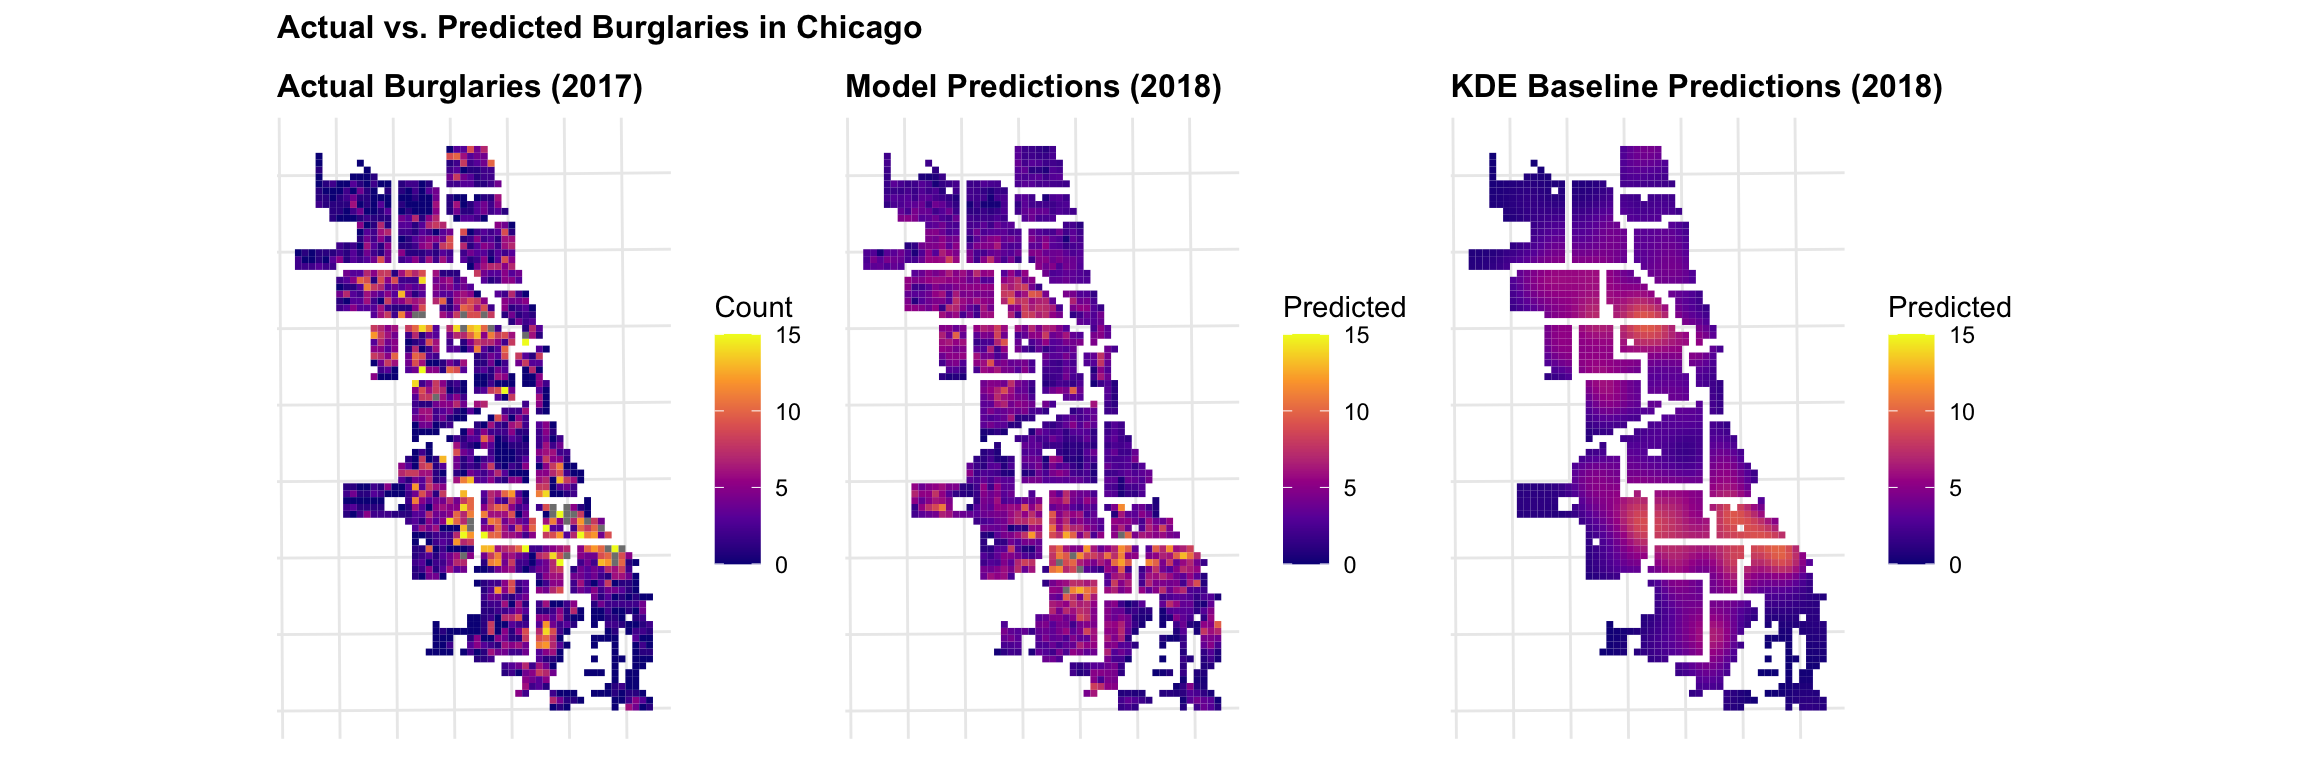
# Add predictions back to fishnet using existing modelfishnet_lights_morans <- fishnet_lights_morans %>%mutate(prediction_nb =predict(model_nb_burglary, fishnet_lights_morans, type ="response") )cat("✓ Generated final model predictions\n")
✓ Generated final model predictions
Code
cat(" - Mean predicted burglaries:", round(mean(fishnet_lights_morans$prediction_nb, na.rm =TRUE), 2), "\n")
- Mean predicted burglaries: 3.81
Code
cat(" - Mean actual burglaries:", round(mean(fishnet_lights_morans$countBurglaries, na.rm =TRUE), 2), "\n")
- Mean actual burglaries: 3.73
Create KDE Baseline
Here, we create a simple baseline using Kernel Density Estimation (KDE). This is a simple baseline because it presents a null hypothesis that burglaries happen neaer where they happened before. If the more complicated model doesn’t outperform this, we need to work on it.
Code
# Convert burglaries to ppp (point pattern) format for spatstatburglaries_ppp <-as.ppp(st_coordinates(burglaries),W =as.owin(st_bbox(chicagoBoundary)))# Calculate KDE with 1000 ft bandwidthkde_burglaries <-density.ppp( burglaries_ppp,sigma =1000, edge =TRUE)# Convert to terra rasterkde_raster <-rast(kde_burglaries)# Extract KDE values to fishnet cellsfishnet_lights_morans <- fishnet_lights_morans %>%mutate(kde_value = terra::extract( kde_raster,vect(fishnet_lights_morans),fun = mean,na.rm =TRUE )[, 2] # Extract just the values column )# Normalize KDE to same scale as countskde_sum <-sum(fishnet_lights_morans$kde_value, na.rm =TRUE)count_sum <-sum(fishnet_lights_morans$countBurglaries, na.rm =TRUE)fishnet_lights_morans <- fishnet_lights_morans %>%mutate(prediction_kde = (kde_value / kde_sum) * count_sum )