Predicting Where Transit Ridership Is Under- or Over-Performing

Identifying Unmet Demand Across the SEPTA Bus Network

Sujanesh Kakumanu, Matthew Levy, Kavana Raju

2025-12-08

The Policy Problem

  • Bus ridership varies widely across stops and corridors
  • Raw ridership doesn’t tell you if a stop is performing well or poorly
  • A low-ridership stop in:
    • low-density, car-oriented area → expected
    • dense, transit-dependent area → may signal unmet demand

Policy Question

Where should SEPTA prioritize investments to maximize ridership and serve unmet demand?

Why Prediction?

  • City officials need a tool to identify:
    • Underperforming stops (barriers, misallocated service)
    • Overperforming stops (latent demand, growth potential)
  • Using a predictive model allows us to:
    • Control for service, demographics, and built environment
    • Compare expected vs actual ridership
    • Uncover hidden opportunities and problem areas

Residuals-Based Planning

Idea

Predict expected ridership using:

  • Service
    • Headways by time of day
    • Number of routes
    • Rail / trolley / regional rail proximity
  • Neighborhood
    • Population density
    • Median income
    • % households with no vehicle
    • % renter-occupied
  • Accessibility
    • Jobs within 15 & 30 minutes by transit
    • Distance to City Hall (CBD)

Interpretation

  • Residual = Actual − Predicted

  • Positive residuals

    • Stop performs better than expected
    • Indicates latent demand
  • Negative residuals

    • Stop performs worse than expected
    • Indicates barriers / mismatched service

Secret Ingredient & Data Sources

Primary Dataset (Secret Ingredient)

  • SEPTA Fall 2024 Bus Ridership
    • Stop-level weekday, Saturday, Sunday boardings & alightings
    • Derived: average weekday boardings / total boardings

Additional Data Sources

  • SEPTA GTFS (Schedules)
    • Headways (AM/PM peak, midday, night)
    • Number of routes per stop
  • Census / ACS 2022 (Tracts)
    • Population, density, median income
    • % no vehicle, commuting patterns
    • Tenure (% renter vs. owner)
  • UMN Accessibility (DRUM)
    • Jobs reachable in 15 & 30 minutes by transit
  • OpenDataPhilly & Spatial Features
    • Philadelphia city boundary & neighborhoods
    • City Hall location (CBD)
    • Distance-to-CBD measure

Exploratory Data Analysis (EDA)

What we did before modeling:

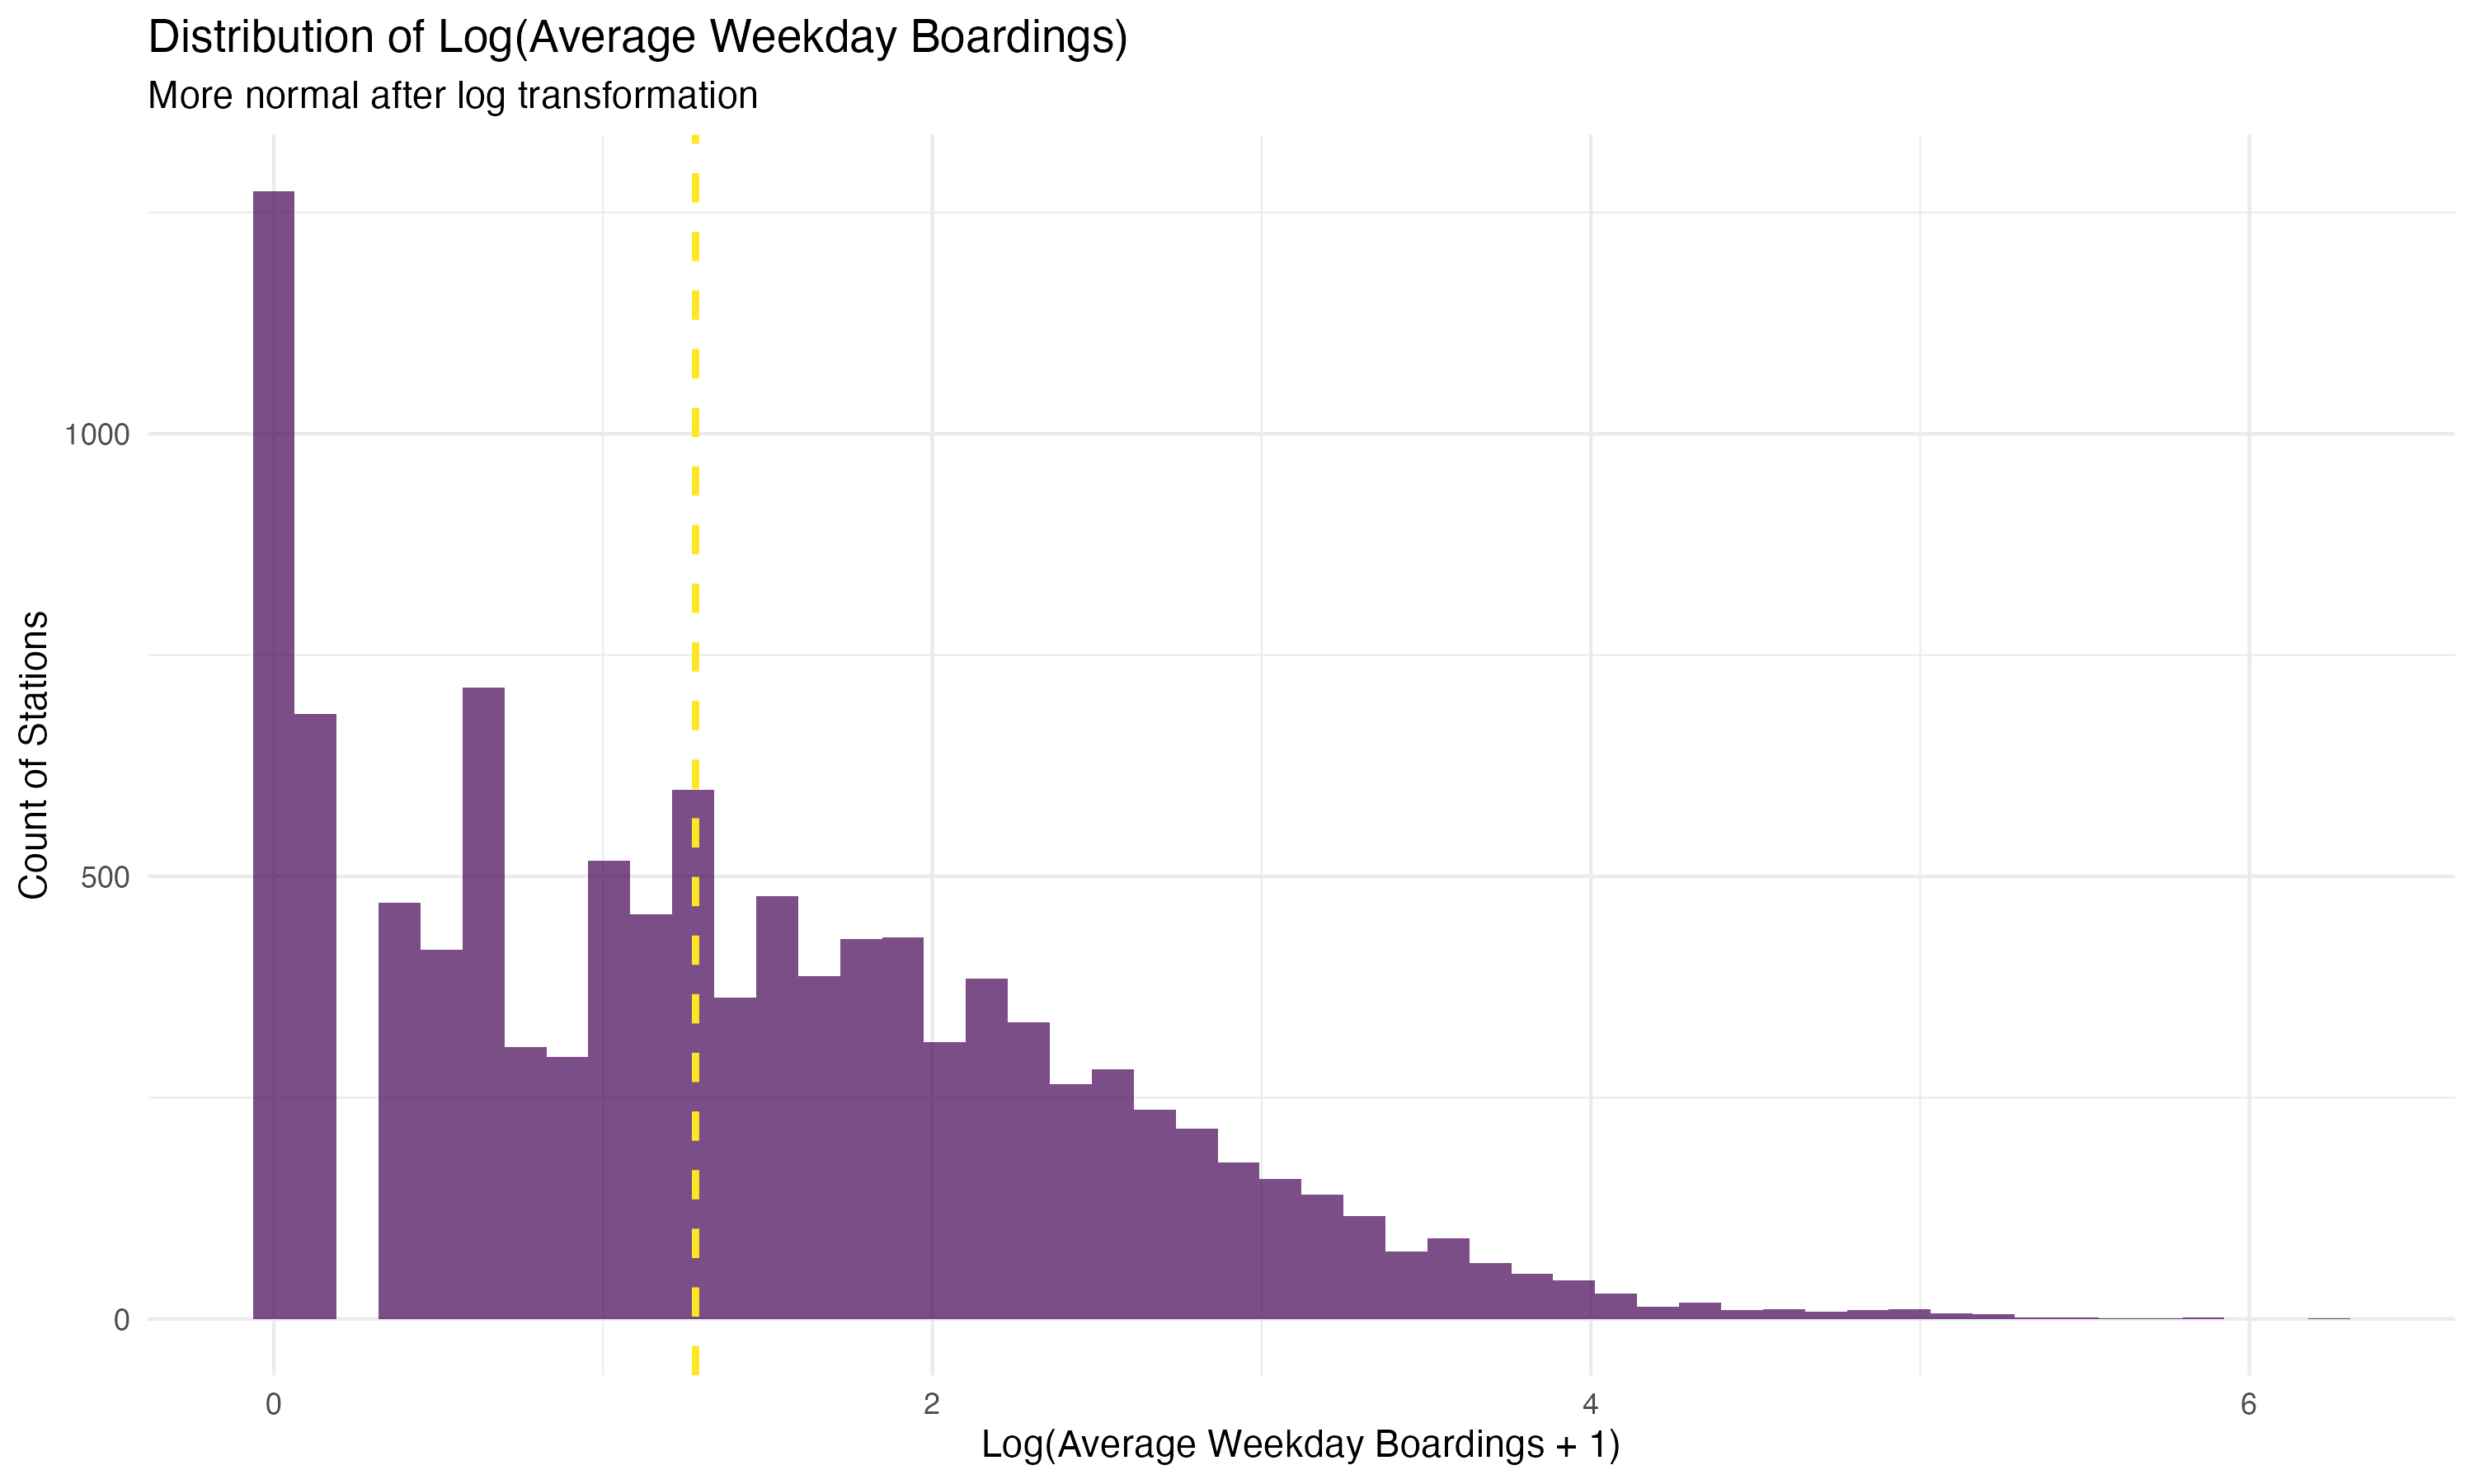
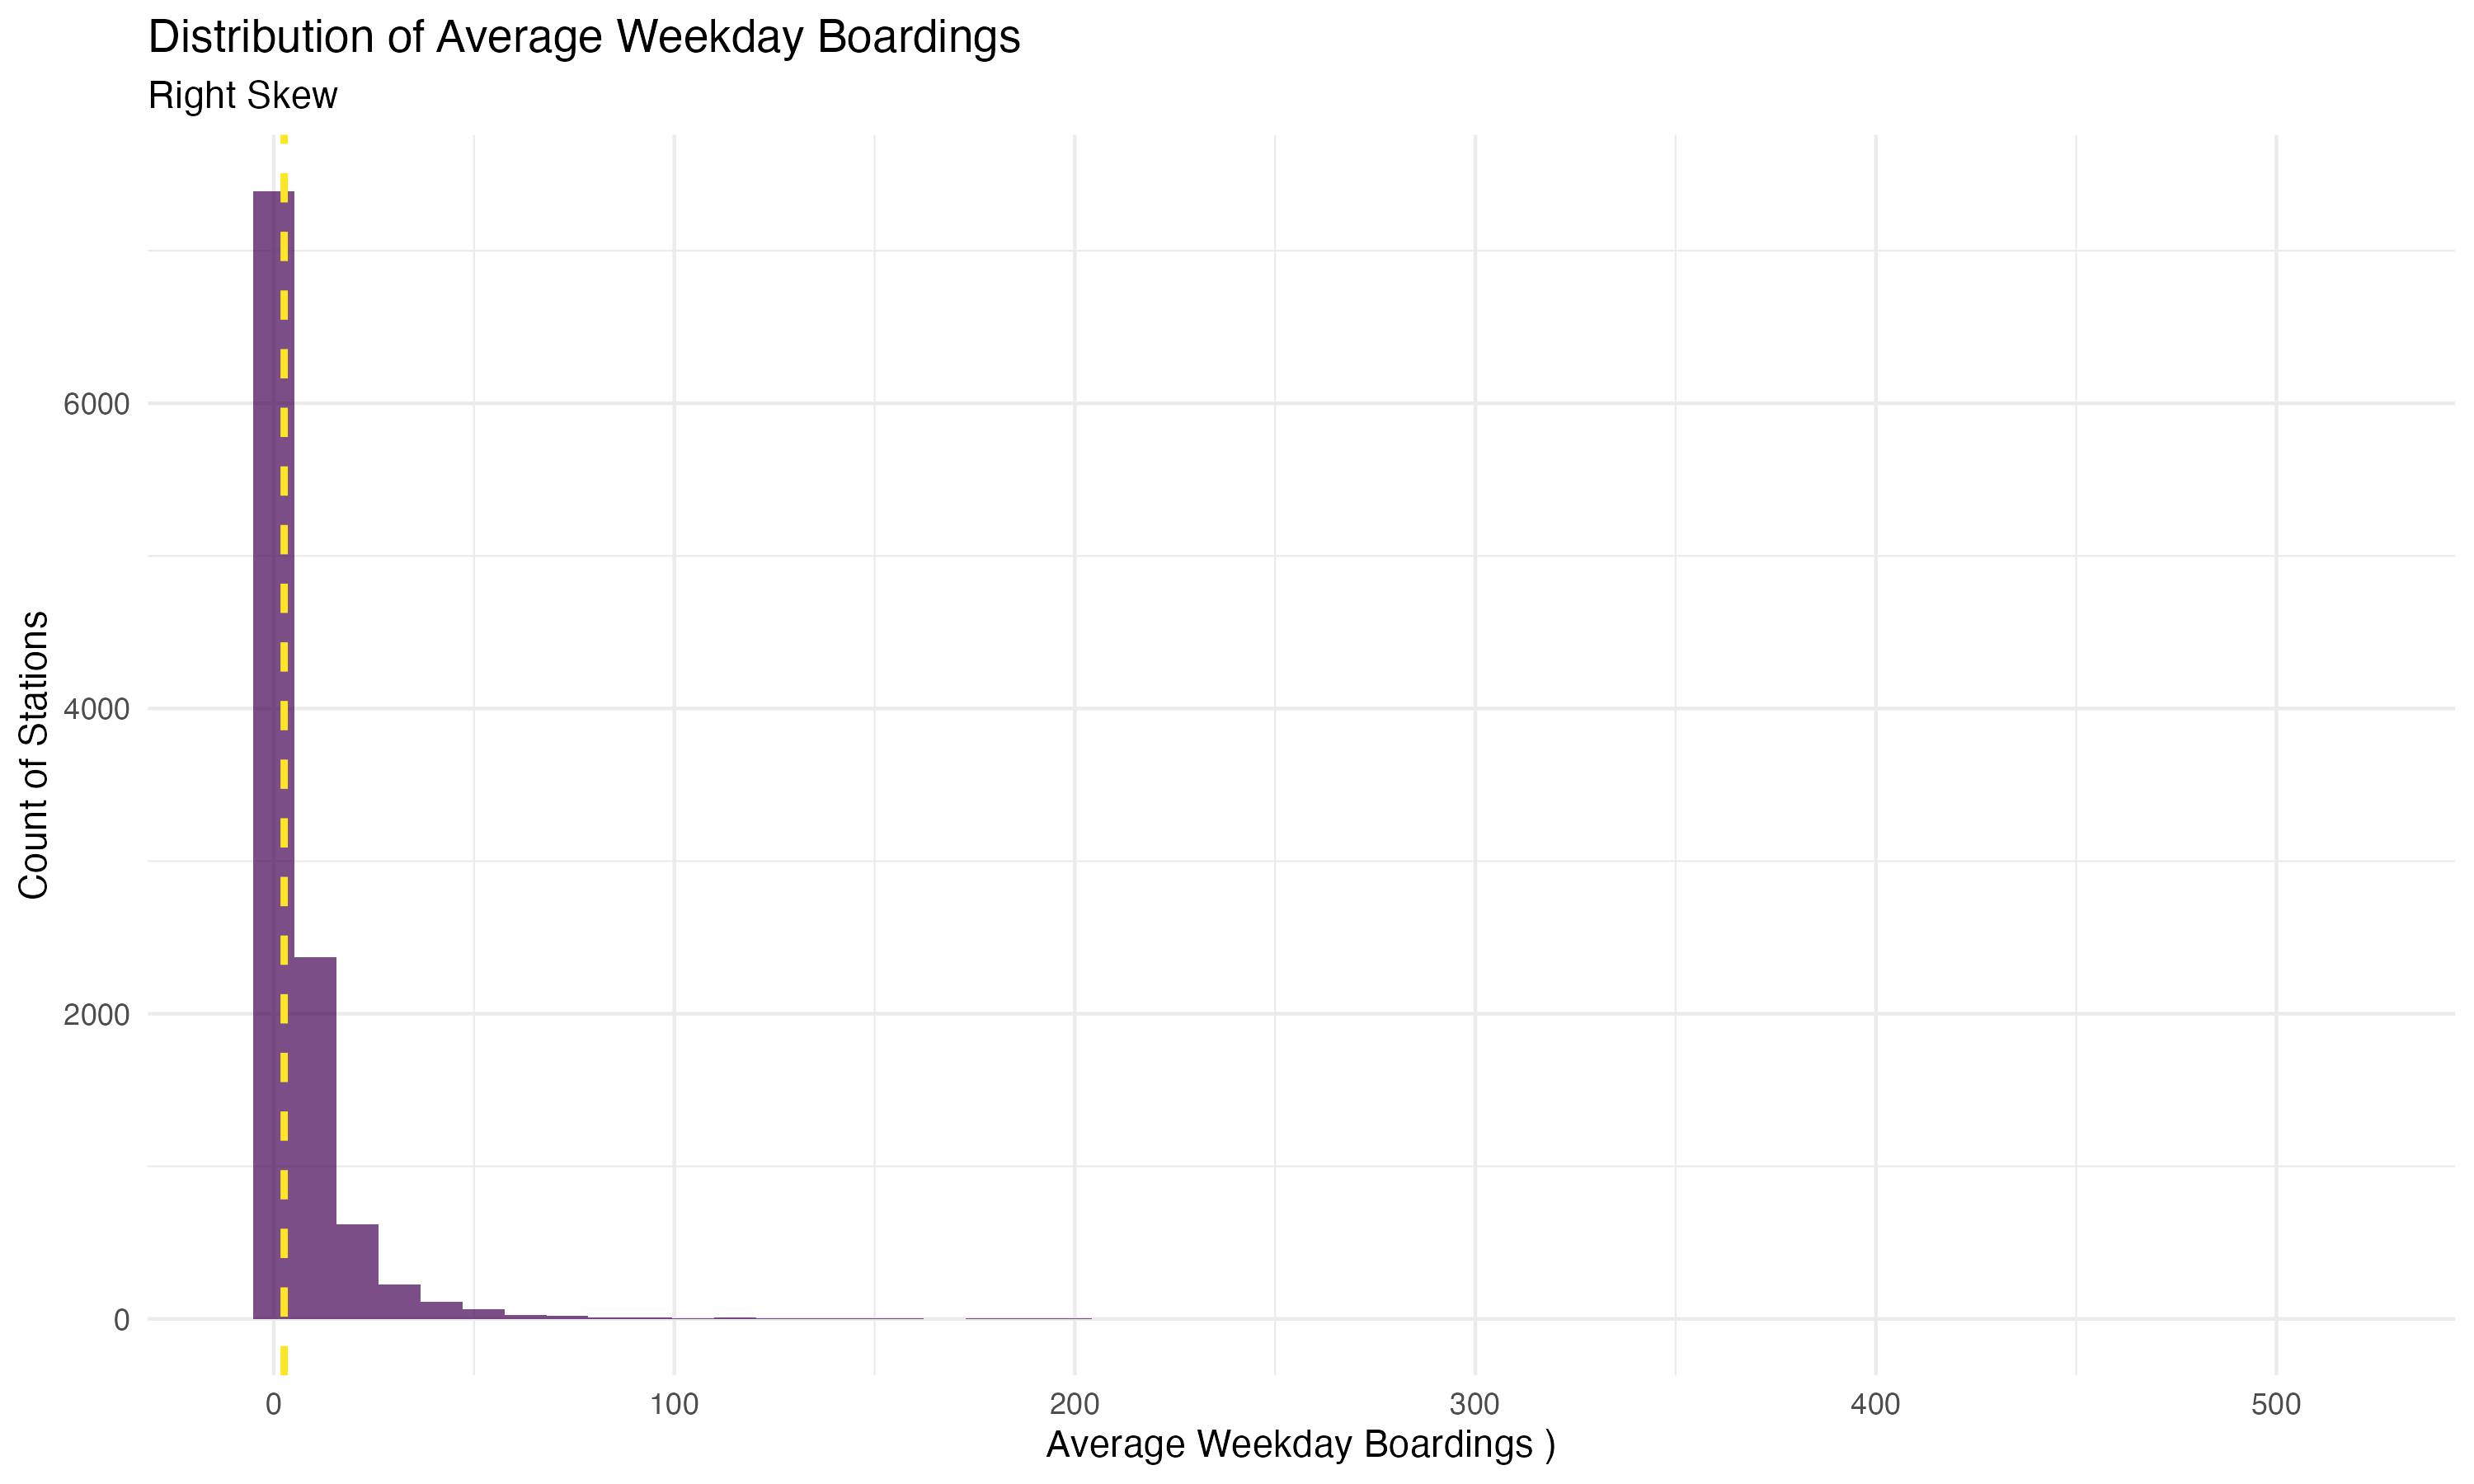
  • Checked distributions:
    • Ridership is highly right-skewed → log-transform
  • Mapped spatial patterns:
    • High-activity corridors & peripheral low-activity areas
  • Ran Local Moran’s I (LISA):
    • High–High and Low–Low clusters of ridership
    • Outliers (High–Low / Low–High) worth investigating

Neighborhood Clustering

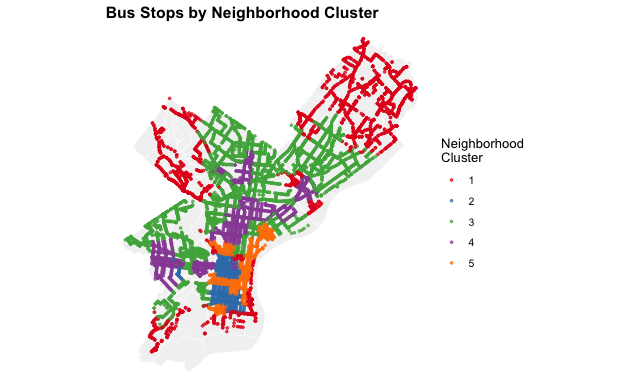
  • Neighborhood bus stops were assigned 1 of 5 clusters
    • Clusters were determined based on similarity in average weekday boardings, median household income, and population density.
  • Clusters were used as predictors, and during model evaluation.
Results

Model Performance

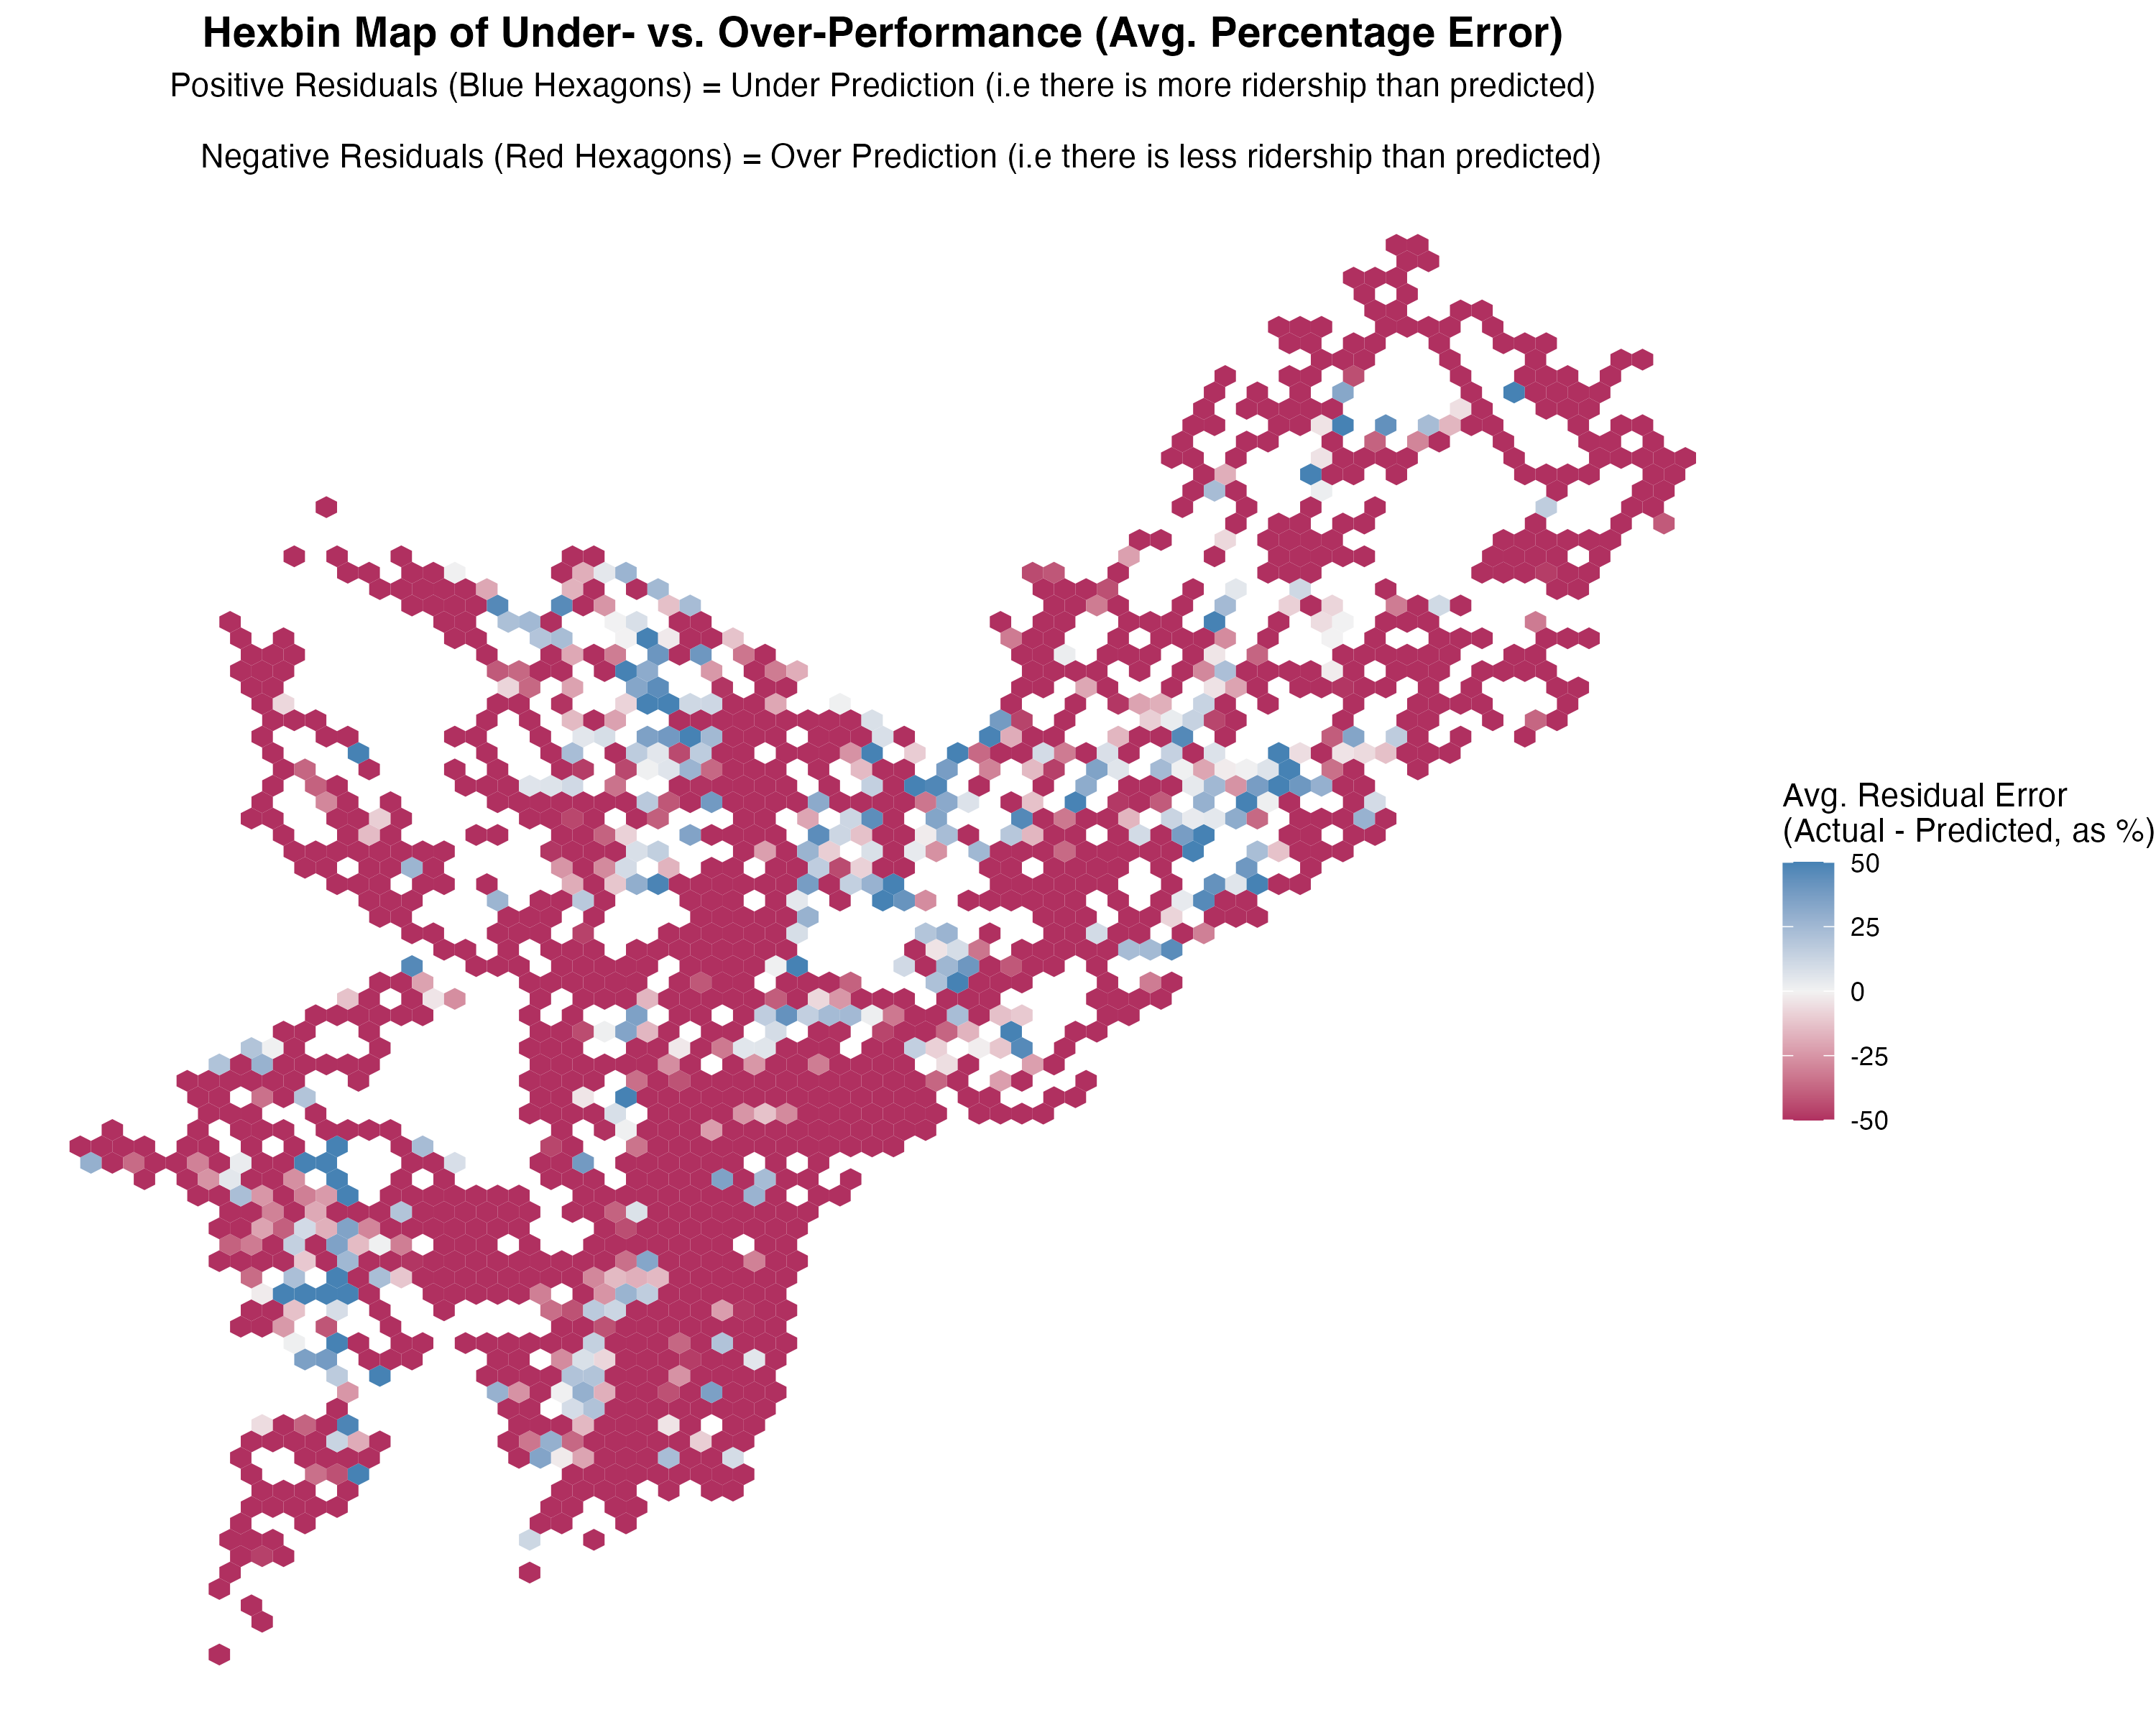
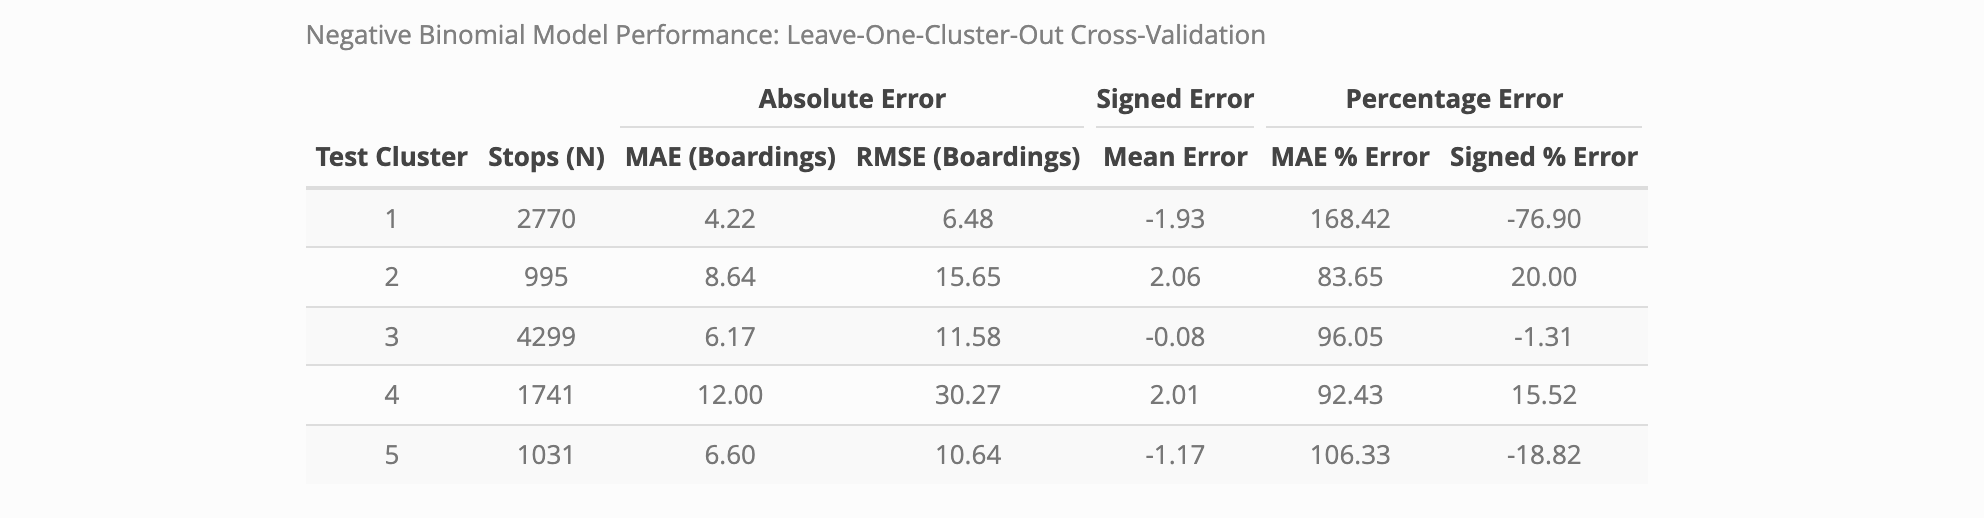
  • Most important value: Signed % Error
    • (+) Error = There is more ridership than our model predicts
    • (-) Error = There is less ridership than our model predicts
  • Note that % is used
    • Stops range widely in expected ridership (some stops have 2-3 boardings; others have 10+ boardings)
Where Is Demand Unmet?

  • Clusters in North, Northeast, and parts of West Philadelphia.
  • Suggestions:
    • Improve Service Frequency and Capacity
    • Increased Infrastructure Investment

Where Are There Barriers?

  • Widespread throughout the city.
  • Should Investigate:
    • Infrastructure Deficiencies
    • Perceived Safety Issues
    • Built Environment Factors

Limitations & Bias

What We Couldn’t Measure

  • The effects of Land-use types
    • Ex: How land-use and time of day interact
  • Measures of service-reliability and perceived-safety
  • Perceived importance of areas that routes connect
  • Relating bike-network connectivity
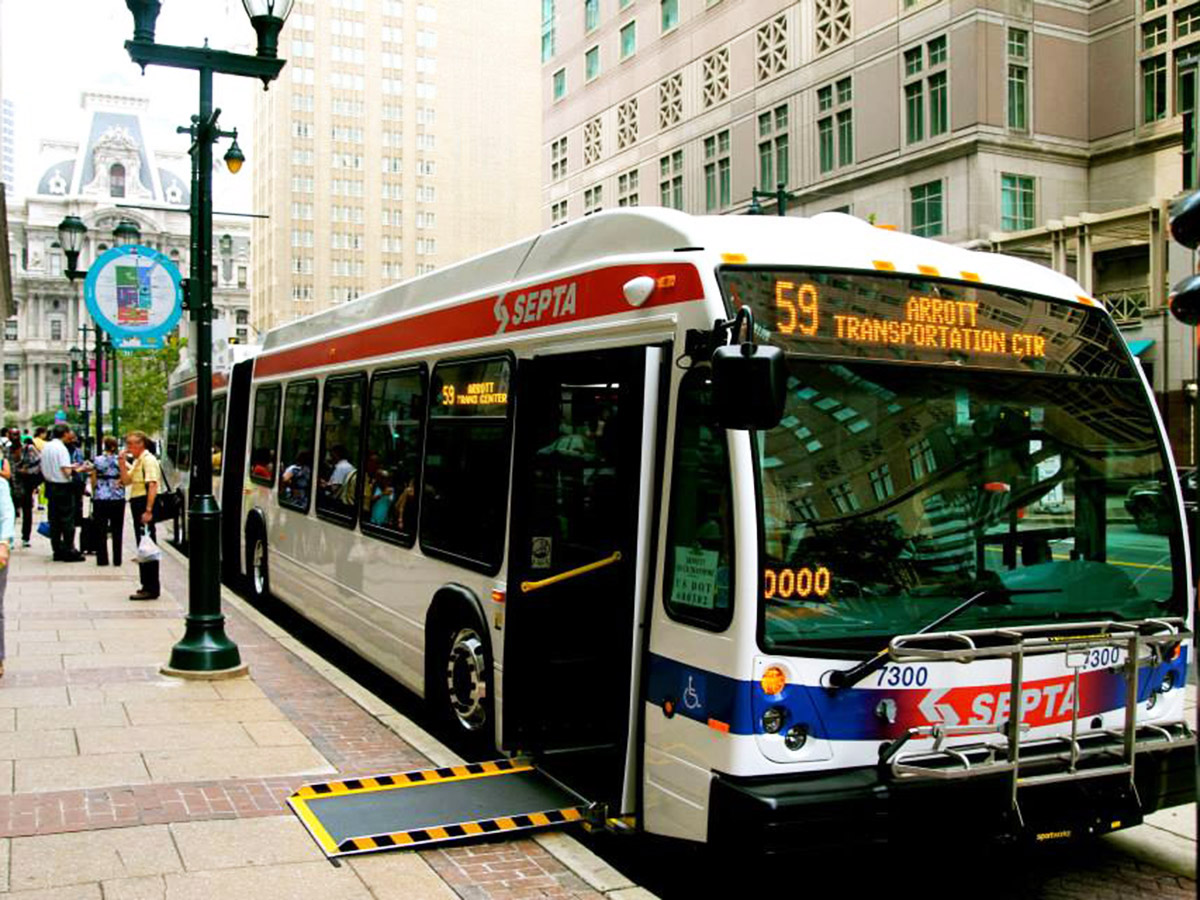
Source: https://www.visitphilly.com/things-to-do/attractions/septa/

Who Could Be Harmed?

  • Our model does not explicitly consider racial components
    • Need to ensure recommended policy is implemented equitably
    • Wealthier, whiter communities tend to be over-represented in political process
  • Our model flattens ridership challenges to over and under predictions
    • Ignores quality of service provided
      • I.e. station covers, lighting, etc.

Should equitable quality of service or improving ridership be prioritized?

Recommendations & Conclusion

How SEPTA Can Use This

  • Prevent “transit death spiral”
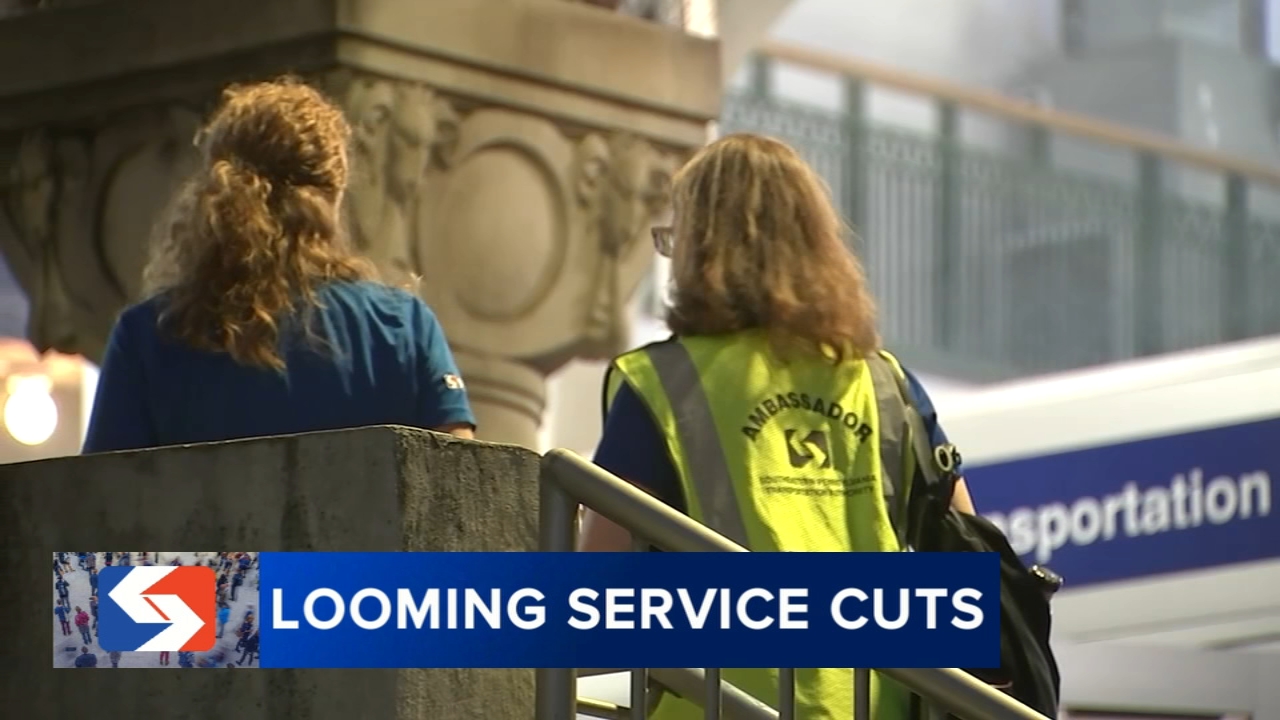
    • Reducing service in response to ridership declines can be a self-fulfilling prophecy
  • Understand where communities are most reliant on transit
  • Investigate where they can expand ridership base
  • Key: Our model is a decision support tool!
Source: 6ABC News

Key Actions

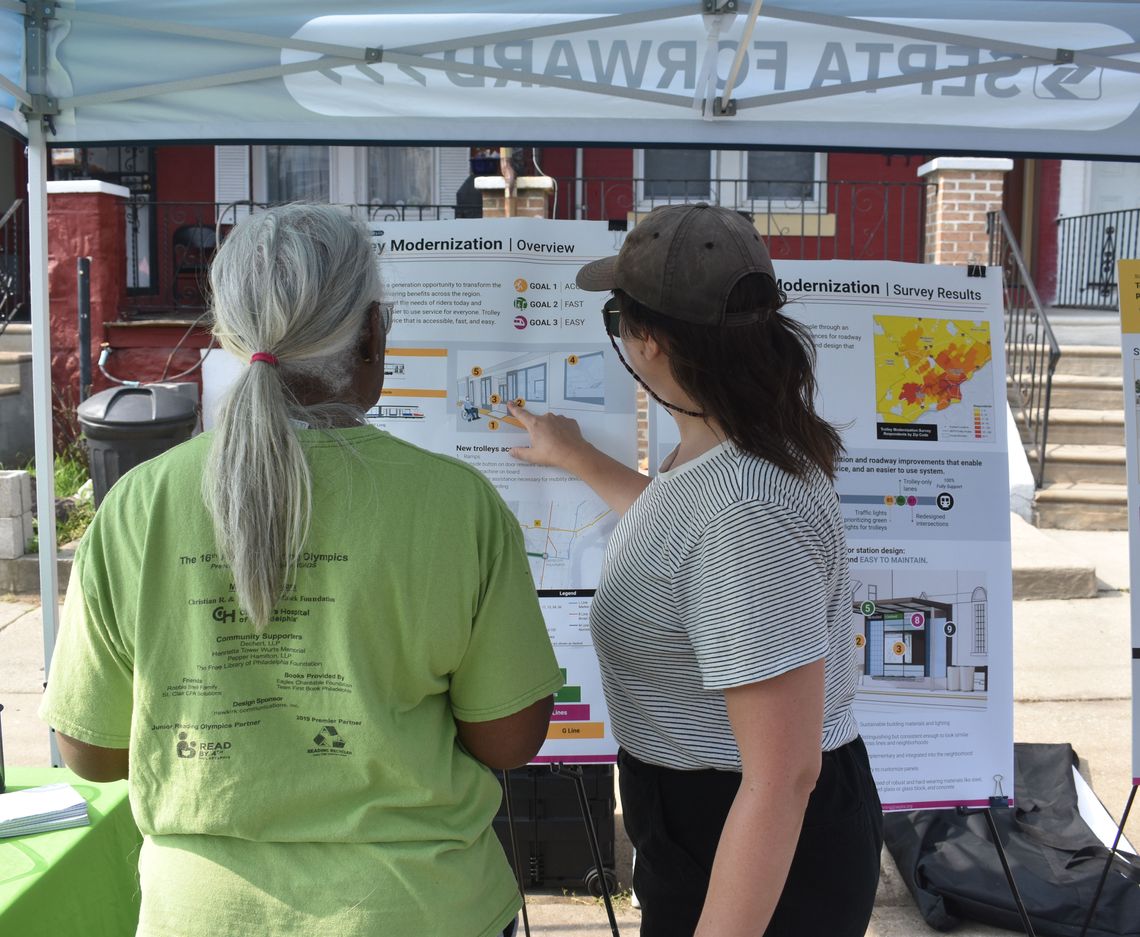
  • Community engagement processes should accompany service changes
    • Especially important in understanding service barriers
  • Be transparent with service choices
  • Equity audits to ensure model is not ignoring communities
Source: https://www.mccormicktaylor.com/our-work/septa-trolley-modernization-station-design-public-engagement

Questions?